

Demographic change since the census
Places in the middle saw the biggest changes
NEIL O’BRIEN
Once every ten years the Census gives us an incredibly powerful set of data we can use to understand our changing country. And each recent census has prompted major debates about demographic change and migration.
But in between times the data we have is really very poor, lacking even the basic information you’d really think we should have. We have for example, no estimate of how many people of different nationalities are currently in the country.
This post aims to use three other data sources – on jobs, births and schools – to update our picture of how the country has changed in the five years since the census, focussing on the issue of migration and demographic change.
Before we launch in, I want to say at the top – I have worked with (and been friends with) people from all over the world – including people of pretty much every ethnicity and religion. This post is not a criticism of anyone, or any group of people. But our society is seeing some huge and rapid changes which we should recognise and talk about. And as we will see – different places are having very different experiences.
One of the strongest pieces of data we have outside the census is from HMRC’s Real Time Information dataset on employment. The published data shows us that the share of employments held by people who were not UK nationals when they first got a national insurance number has increased to over 20%, driven by a growing share of non-EU nationals:
I used Freedom of Information to get this data broken down by local authority, and have now used a new FOI request to get it updated to the end of 2025.
The map below shows the change in the share of all employments held by non-UK nationals over the last five years. As you can see, a lot of the biggest changes since the census have been in mid-sized cities and towns: Preston, Middlesbrough, Coventry and so on – smaller cities which stand out as dark dots below. Perhaps surprisingly, inner London hasn’t actually changed so much:
Here’s the same data as a scatterplot. A lot of the biggest changes have been for places that had middling levels of non-UK nationals in the workforce in 2021. Places like Brent and Westminster still have more non-UK nationals in the workforce, but the change since the census has been smaller there, while changes have been pretty big in places you might not think of as particularly diverse: Middlesborough, Sunderland, Dundee, Preston, Gloucester – and so on:
Don’t get me wrong – if we look at the level not the change, London still has far more non-UK nationals in the workforce than other places – over 60% employments in Newham now. But the relative difference may be more apparent to local people when Sunderland goes from 5% to 13% or Middlesbrough from 10% to 24% than when Westminster goes from 52% to 53%.
Let’s turn to look at another solid data source. There is effectively a “census” of babies every year, with good data from ONS.
It shows that the number of babies born to women born in the UK has fallen a lot and is at a record low. The number born to mothers from abroad has increased a bit and the mix has changed too in recent years there have been fewer from the EU, and more from the rest of the world:
The share of babies born with at least one migrant parent reached 40% for the first time last year, driven by a fall in the number of kids with two parents from the UK.
Obviously there are different numbers of women in the UK who were born in and outside the UK, so to understand the trends we might want to look at birth rates too.
ONS did produce data on fertility rates of women born inside and outside the UK, but had stopped – so I put in a freedom of information request to ONS to get them to update their work. The updated data is shown below. As you can see, the fertility rate of women born in the UK (of all ethnicities) has hit a new record low.
The impact of previous migrants is not enough to give the UK a stable population and that gap between UK born and non-UK born parents is likely to increase the rate of demographic change over time.
The gap between the two seemed to have narrowed in about 2016 – but has widened out again since.
What do these numbers mean? Well, at a TFR of 1.41, every 100 people will have 50 grandchildren, and at 1.96 they will have 96 grandchildren, so this birth rate difference, which might sound small, will actually bake in a lot of change for the coming decades:
Again, we see quite an uneven change across the country. And again we see that areas with middling shares of parents born abroad in 2021 generally saw the biggest increases in recent years – places like Middlesbrough, Sunderland, Lincoln and Bolton.
Here is the same thing on a map – again the smaller cities and towns stick out. Bits of Inner London actually see a smaller proportion of babies with a parent born abroad, while Outer London sees more.
Again, don’t get me wrong, when we look at the levels, not the change, London still has radically more children born with one parent from overseas – 84% of those born in Brent for example. Likewise in the other big cities – 61% in Birmingham and 65% in Manchester have a parent from overseas. But again, the change may feel greater in some of those smaller places.
Finally, lets look at a third data source.
Schools collect detailed data each year on their pupils. In 2017 an attempt was made to start collecting information on which countries kids were from, which would have allowed us to look at the impact of migration directly. But there was an organised campaign to block the collection of this data, with hard-left activists saying that mild-mannered Education Secretary Nicky Morgan was awful for even wanting to know this information.
So instead we will have to look at slightly less direct data, on the ethnicity of pupils. Interestingly, the surge in migration over recent years isn’t really visible in this data – instead we see the continuation of the previous trends. This may be because the large number of recent arrivals don’t have children of school age yet?
The share of parents describing their children as white British is falling, and the share identifying with an ethnic minority or mixed ethnicity is rising. This year’s data is the first time the share of pupils who are white British is below 60%. The trend is pretty linear – if the trend of the last couple of decades continues, white British pupils will be a minority by 2036. That’s not far off – those starting school this year will still be at school then.
This change is not uniform across the country. Whether you look at it either in absolute or proportional changes, the big demographic changes in schools have not been in the inner urban areas that already had a lot of minority ethnic pupils in 2021.
Again, the boig changes have been in mid-sized cities and places that have not been particularly diverse to date: Middlesbrough, Bolton, Doncaster, Warwickshire and so on – shown in red below. The shires are seeing nearly as big a change: Cambridgeshire, Oxfordshire, Cheshire etc are shown in orange below (this map below makes the size of all authorities proportional to their population by the way).
To some extent the share cannot really fall much in inner London because it is already so low – just 5% in Newham for example. But on the other hand the change is not purely a reflection of the prior level – in fact the biggest changes have been in areas that had middling levels of diversity back in 2021. It’s that same curve again, perhaps clearest of all here:
Consistent with the u-shaped curve above, quite a few of the places where schools will become majority-minority in the next few years are not places that are thought of as particularly diverse:
And to make the same point one last time for completeness, the change is of course not the level. London continues to have far more pupils from ethnic minorities – only 7% in Harrow and only 5% in Newham are white British:
Each of these data sources is valid and solid and shows you the change, and it is interesting that there is a similar trend visible in all three – the most change is happening in the middling sorts of places.
I did wonder if we could use the three more up-to-date sets of data to make inferences about what is happening to different areas overall? Could we use this to update the census data?
Sadly, not with any confidence. Comparing the data on births, pupils and employments even for 2021 to the 2021 census we find big variations – even when we compare school pupils to the school age, and employments to the working age.
Though it is the gold standard, the census itself has about 3% of people imputed and a further 1.3% not answering the question on ethnicity. The census itself was somewhat warped by being done in the tail end of the pandemic. Some British people temporarily moved out of London in 2020/21 and flowed back in again later, and migrant movement patterns were different.
School pupils move around and cross borough boundaries – or move out to the independent sector – compared to census 2021 the schools census implies there are fewer white British kids in inner London and the centres of other cities like Nottingham, Manchester, Sheffield and Leeds. Elsewhere, it implies there are more.
There is a correlation between census data for how many people live in a place and the employment data for those who work in it – but it is a fuzzy correlation. One reason is that different ethnic minority groups have radically different rates of employment in different places – e.g. the share of employments among British people is probably higher than you’d expect given the demographics of adults living in Birmingham, and it’s lower in Oxford and Cambridge – this is probably because in the west midlands you have ethnic groups with low employment rates, and you have lots of students not working in Oxbridge. So we can’t project out wider conclusions from these three sets of data with any confidence.
While this piece is mainly about the demographic change in different places, I thought I would quickly look again at whether the fiscal position of different groups has changed since the census – have the large numbers of new people arriving given us a big fiscal boost?
The only really comprehensive data is from ONS, The Effect of Tax and Benefits. Other analysis, for example by by the Migration Advisory Committee doesn’t cover some migration groups yet.
The ONS data is not broken down by migration status – only by ethnicity. And the sample size is limited. But there is no suggestion from it that the dramatic demographic changes described above have led to a major fiscal boost.
ONS only publish some large aggregate groups, and told me they can’t break it down further (e.g. by disaggregating “Asian” or “Black”), because of the sample size.
But it remains the case that the only ethnic group which has a net positive fiscal contribution is the white group. Asian, mixed and “other” ethnic groups have become more negative over recent years since the census. Black British people saw their position decline then improve a bit, but the balance remained pretty negative.
Data on employments, births and school pupils gives us an updated sense of what demographic change is meaning for different parts of the country.
One interesting trend that I had not clocked before is the tendency for places “in the middle” to see the biggest changes.
Looking at the data above also reveals the incredible demographic change that has happened in my lifetime, and the breathtaking pace of change in recent years.
The “economic argument” for mass immigration has completely collapsed – the UK and other countries have seen incredible rates of immigration and it has not proved to be remotely the economic rocket fuel that migration boosters claimed. Instead we have sky high rents and dire productivity. Given the numbers from the ONS above, I’m sceptical that the long term impact of immigration has been a big fiscal boost.
But there is something beyond the economic argument here. The incredible scale and pace of the changes makes the case for not just tweaks to migration policy but a fundamentally different approach, which starts from zero. Yes, the UK can and should obviously deport all foreign criminals – and obviously we should not allow people who are welfare dependent to remain or become citizens – that’s a no-brainer. But also, though it has come down a bit, legal migration is still just far too high. With 703,000 non British people arriving during 2025, that’s still huge change every year.
Within cultural elites, many people think that the view of many voters – the view that “I would prefer it if members of my group continued to form a majority, and continued to set the tone for how things work here” – is racist.
I don’t agree. You can get on with many types of people and avoid pre-judging people and enjoy other cultures, and yet still prefer your area and your country to be mainly full of people like you. People who have some history in your culture, rather than a transient hotel-like country with an ever-shifting mix of strangers.
There is even a sort of citizen-of-the-world version of this argument. We want France to be France, Spain to be Spain, Japan to be Japan. I think it is legitimate for some places to limit foreign tourists for example. We don’t want to visit another country only to find that it has become just the same slew of Starbucks and identikit buildings that you could find anywhere in the world. Britain is no different.
On the Conservative side we have said that our cap will see sustained net negative migration. Looking at the data above, it is not hard to see why so many people want mass migration to end completely.
See Related Article Below
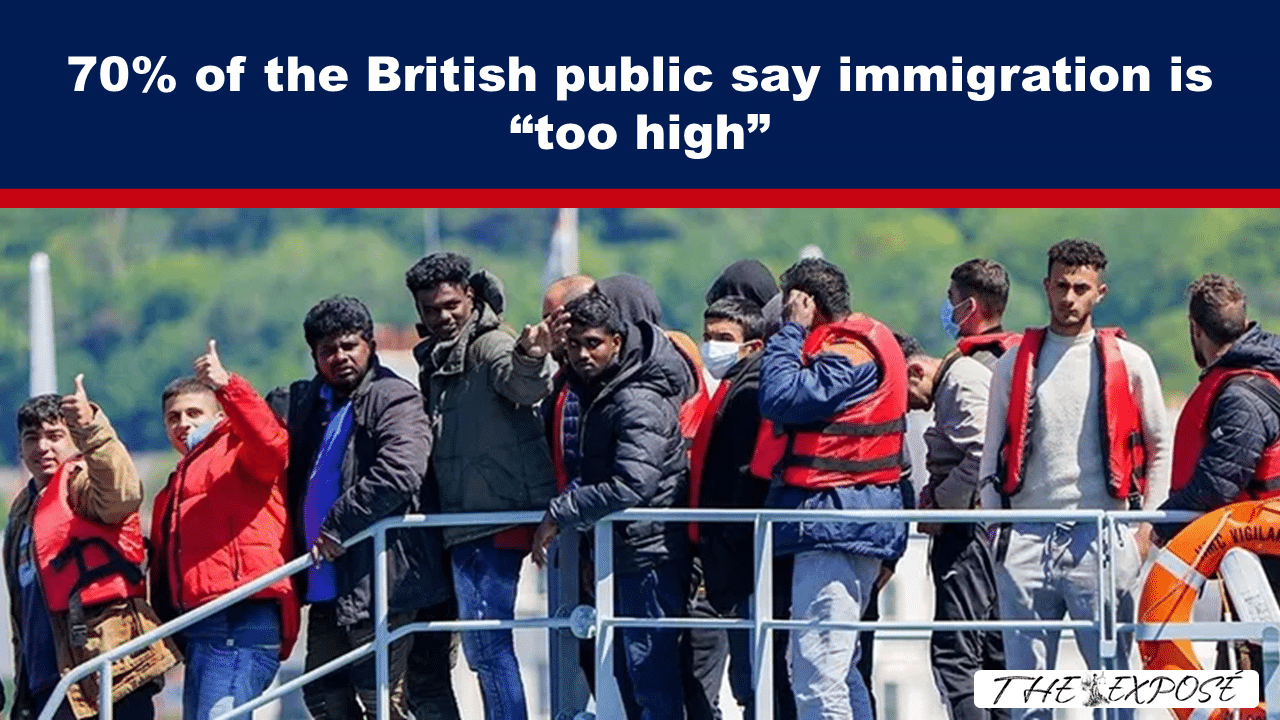
70% of the British public say immigration is “too high”
RHODA WILSON
A recent YouGov poll shows that almost 70% of the British public think immigration levels are “too high.”
The fringe minority is not people who want migration lowered as the establishment left want you to believe; the fringe minority is the 20% who think the immigration level is “about right.”
The British People Are Turning Against Immigration
By Matt Goodwin, 14 August 2026
For more than a decade, the political and media establishment in Britain has told itself a comforting story.
The shock vote for Brexit, more than a decade ago, was just the “last gasp” of an older, more conservative Britain that struggles to accept the modern world.
Yes, some 17 million people might have voted to leave the European Union and given the establishment a bloody nose. But this was only a temporary revolt – a brief interruption on Britain’s inevitable journey towards a far more “liberal” [as in hard or far left-wing] future.
And in the years since – they continually tell us – new generations of younger, more diverse and “better educated” British people have arisen to continue pushing Britain towards this far more socially “liberal,” cosmopolitan, or “progressive” horizon.
Ever more supportive of immigration. Ever more supportive of demographic change and rising diversity. Ever more relaxed about “modern Britain.” And ever more embarrassed about the vote for Brexit and the desire to “take back control.”
This is the narrative that countless politicians, academics and columnists push.
Alastair Campbell. Rory Stewart. Emily Maitlis. Polly Toynbee. Owen Jones. Former Times columnist David Aaronovitch. “Liberal” pollster Peter Kellner. Academic activists like Jon Portes and Rob Ford. They have all made variations of this argument.
You know the type.
Smug illiberal “progressives” who think the future belongs to them, who preach about the wonders of diversity but refuse to tolerate genuine diversity of thought, who portray anybody who holds a different view as some kind of fascist, and who probably look at a newsletter like ours as representing a fringe minority.
Well, take a look at what is happening now.
A few days ago, a remarkable new study by the polling company YouGov completely dismantled this argument by comparing what the British people think today with what they thought at the time of the Brexit referendum, a decade ago.
And what did they find?
Contrary to all the talk and all the predictions about the British people embracing things like immigration and diversity, the pollsters found a very different story and one that reveals just how badly the establishment continues to misread Britain.
For a start, they found that over the last decade the British people have not become more supportive of immigration over the last decade. Far from it. They are just as likely today as they were a decade ago to think immigration into Britain has been “too high” – a view which, consistently, seven in ten people hold.
While you won’t hear this on the BBC or one of the countless podcasts produced for the liberal minority, large majorities of British people think migration has been too high, with roughly half the country – 47% – saying it’s “much too high.”
There’s been no move leftwards. No “liberalisation.” The British people remain just as convinced that there’s too much migration as they were a decade ago.
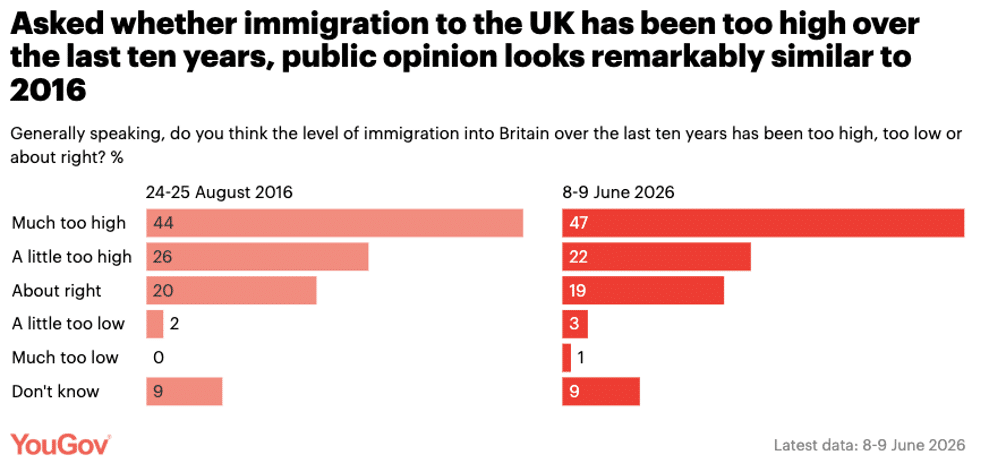
Britons have a more negative view of immigration in 2026 than in 2016, YouGov, 10 August 2026
The fringe minority, in other words, is not people who want migration lowered; the fringe minority is the one in five people in Britain who think the level is “about right”.
Contrary to what all those columnists and academics tell us, furthermore, these views are also held widely among the young, too. Britain’s 18-24-year-olds are more likely to say immigration has been “too high” than say it’s been “too low” or “about right”. Again, this is not something that ever seems to feature in media vox-pops.
And that’s not even the most interesting part.
Because the pollsters also found something else that really does destroy the establishment narrative and which, I think, helps to explain why politics is so volatile at the moment.
About the Author
Matthew “Matt” Goodwin is a British political scientist and commentator known for his research on populism and right-wing movements. He was a professor of politics at the University of Kent until July 2024.
Goodwin has authored several books, including ‘Values, Voice and Virtue: The New British Politics’ and ‘National Populism: The Revolt Against Liberal Democracy’ (co-authored with Roger Eatwell), and ‘Revolt on the Right: Explaining Support for the Radical Right in Britain’ (co-authored with Robert Ford).
You can follow him on Substack, YouTube, Instagram, TikTok, Twitter/X and Facebook.

••••
••••
••••
••••
(UKR)